
Maps and geocoding API benchmark 2026: Google Maps Platform, Mapbox, HERE, TomTom and more
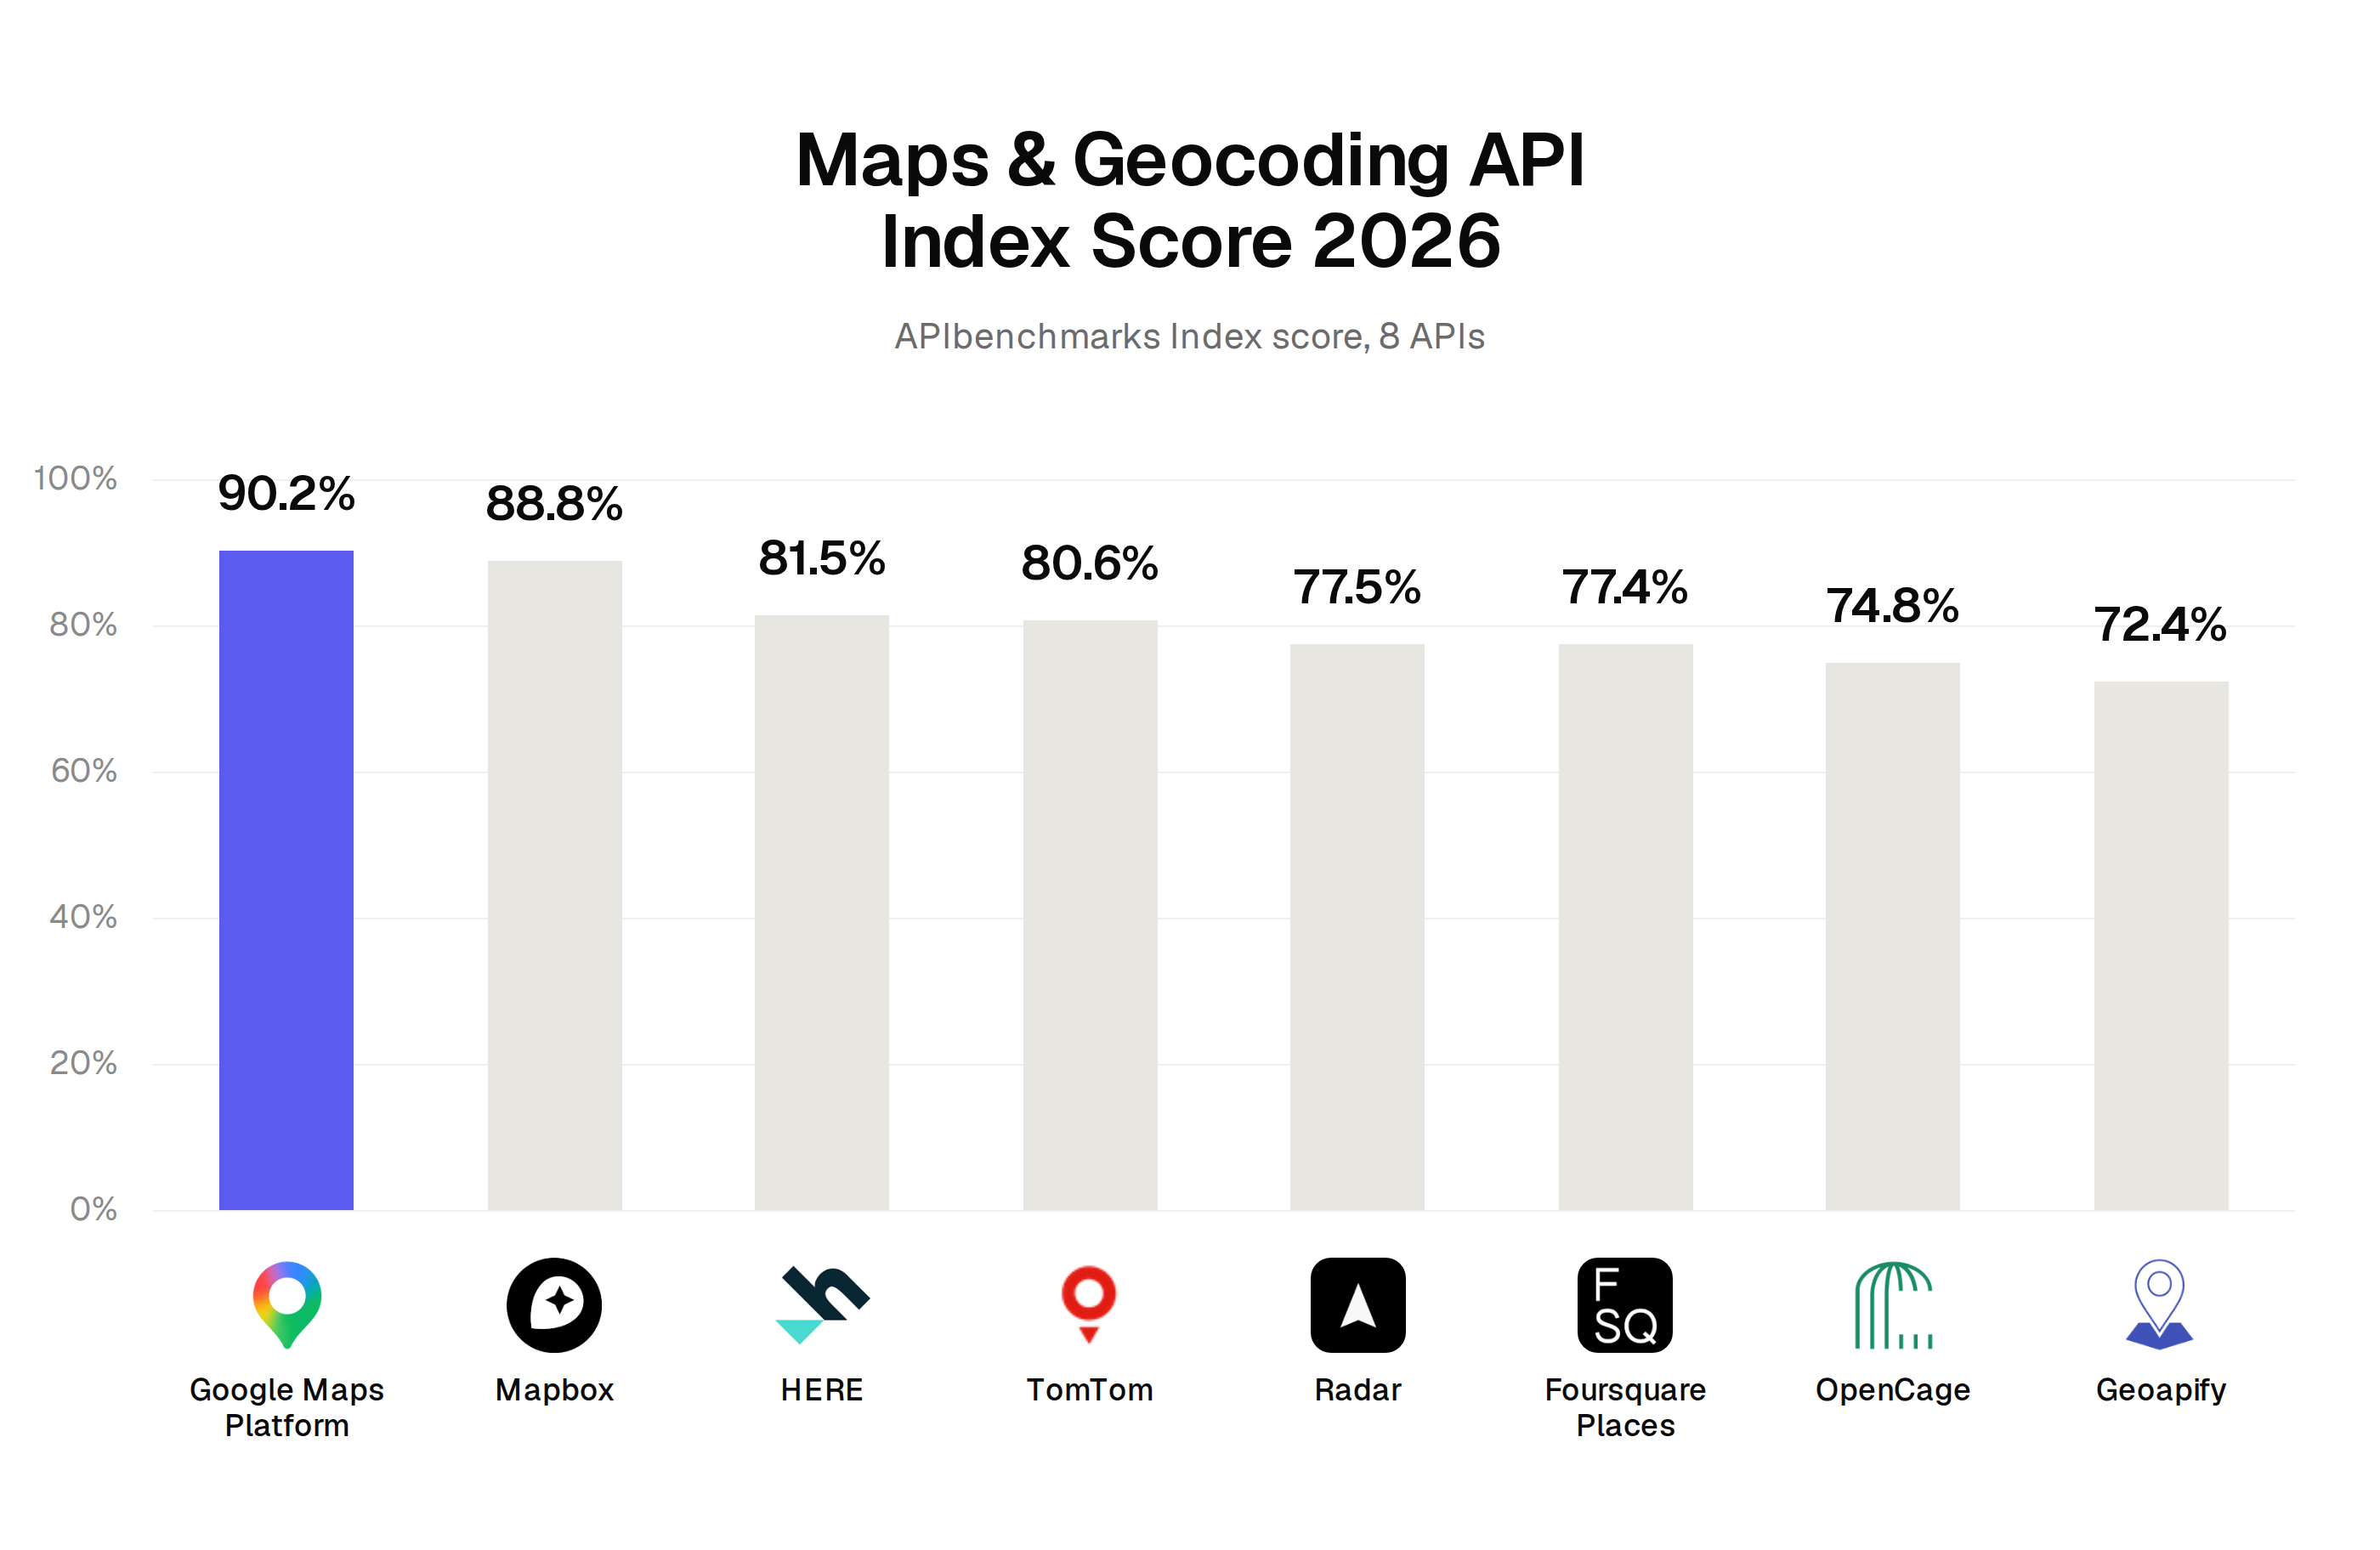
Google Maps Platform scores 90.2 in the APIbenchmarks Index, ahead of Mapbox at 88.8. HERE, TomTom, Radar, Foursquare Places, OpenCage and Geoapify follow.
Google Maps Platform ranks first of the eight maps and geocoding APIs in the APIbenchmarks Index, with a score of 90.2 and a grade of A. Mapbox is second at 88.8, 1.4 points behind. HERE follows at 81.5, then TomTom at 80.6, Radar at 77.5, Foursquare Places at 77.4, OpenCage at 74.8 and Geoapify at 72.4. The surprise is at the bottom of the table. OpenCage has the highest accessibility score of all eight at 95, and Geoapify has the second highest at 92, while Google Maps Platform scores 80.
The APIbenchmarks Index scores each API on four things: documentation, reliability, ecosystem and accessibility. It is a score of how well an API is documented, how dependable it is, how much sits around it and how easy it is to start using. It does not measure how accurate any one geocoder is on a list of addresses.
The short version:
- Google Maps Platform leads at 90.2, 1.4 points ahead of Mapbox at 88.8. Mapbox is 7.3 points ahead of HERE in third.
- Google leads on reliability (96 against 85 for Mapbox) and ecosystem (95 against 90). Mapbox leads on documentation (90 against 88) and accessibility (90 against 80).
- OpenCage (74.8) and Geoapify (72.4) are last overall but first and second on accessibility. Their reliability and ecosystem scores are the lowest in the group.
Which maps and geocoding API ranks highest?
Google Maps Platform ranks highest, at 90.2. It and Mapbox are the only two APIs in this category with a grade of A. HERE, TomTom, Radar and Foursquare Places have a B, and OpenCage and Geoapify have a C.
| Rank | API | Index score | Grade |
|---|---|---|---|
| 1 | Google Maps Platform | 90.2 | A |
| 2 | Mapbox | 88.8 | A |
| 3 | HERE | 81.5 | B |
| 4 | TomTom | 80.6 | B |
| 5 | Radar | 77.5 | B |
| 6 | Foursquare Places | 77.4 | B |
| 7 | OpenCage | 74.8 | C |
| 8 | Geoapify | 72.4 | C |
The table has three tiers. Google and Mapbox sit alone at the top. HERE, TomTom, Radar and Foursquare Places fall within 4.1 points of each other, and Radar and Foursquare Places are 0.1 points apart. OpenCage and Geoapify are 2.4 points apart at the bottom. From first to last the spread is 17.8 points. The full category page is at /maps, and the maps verdict summarises it.
Where does Google Maps Platform lead, and where does Mapbox win?
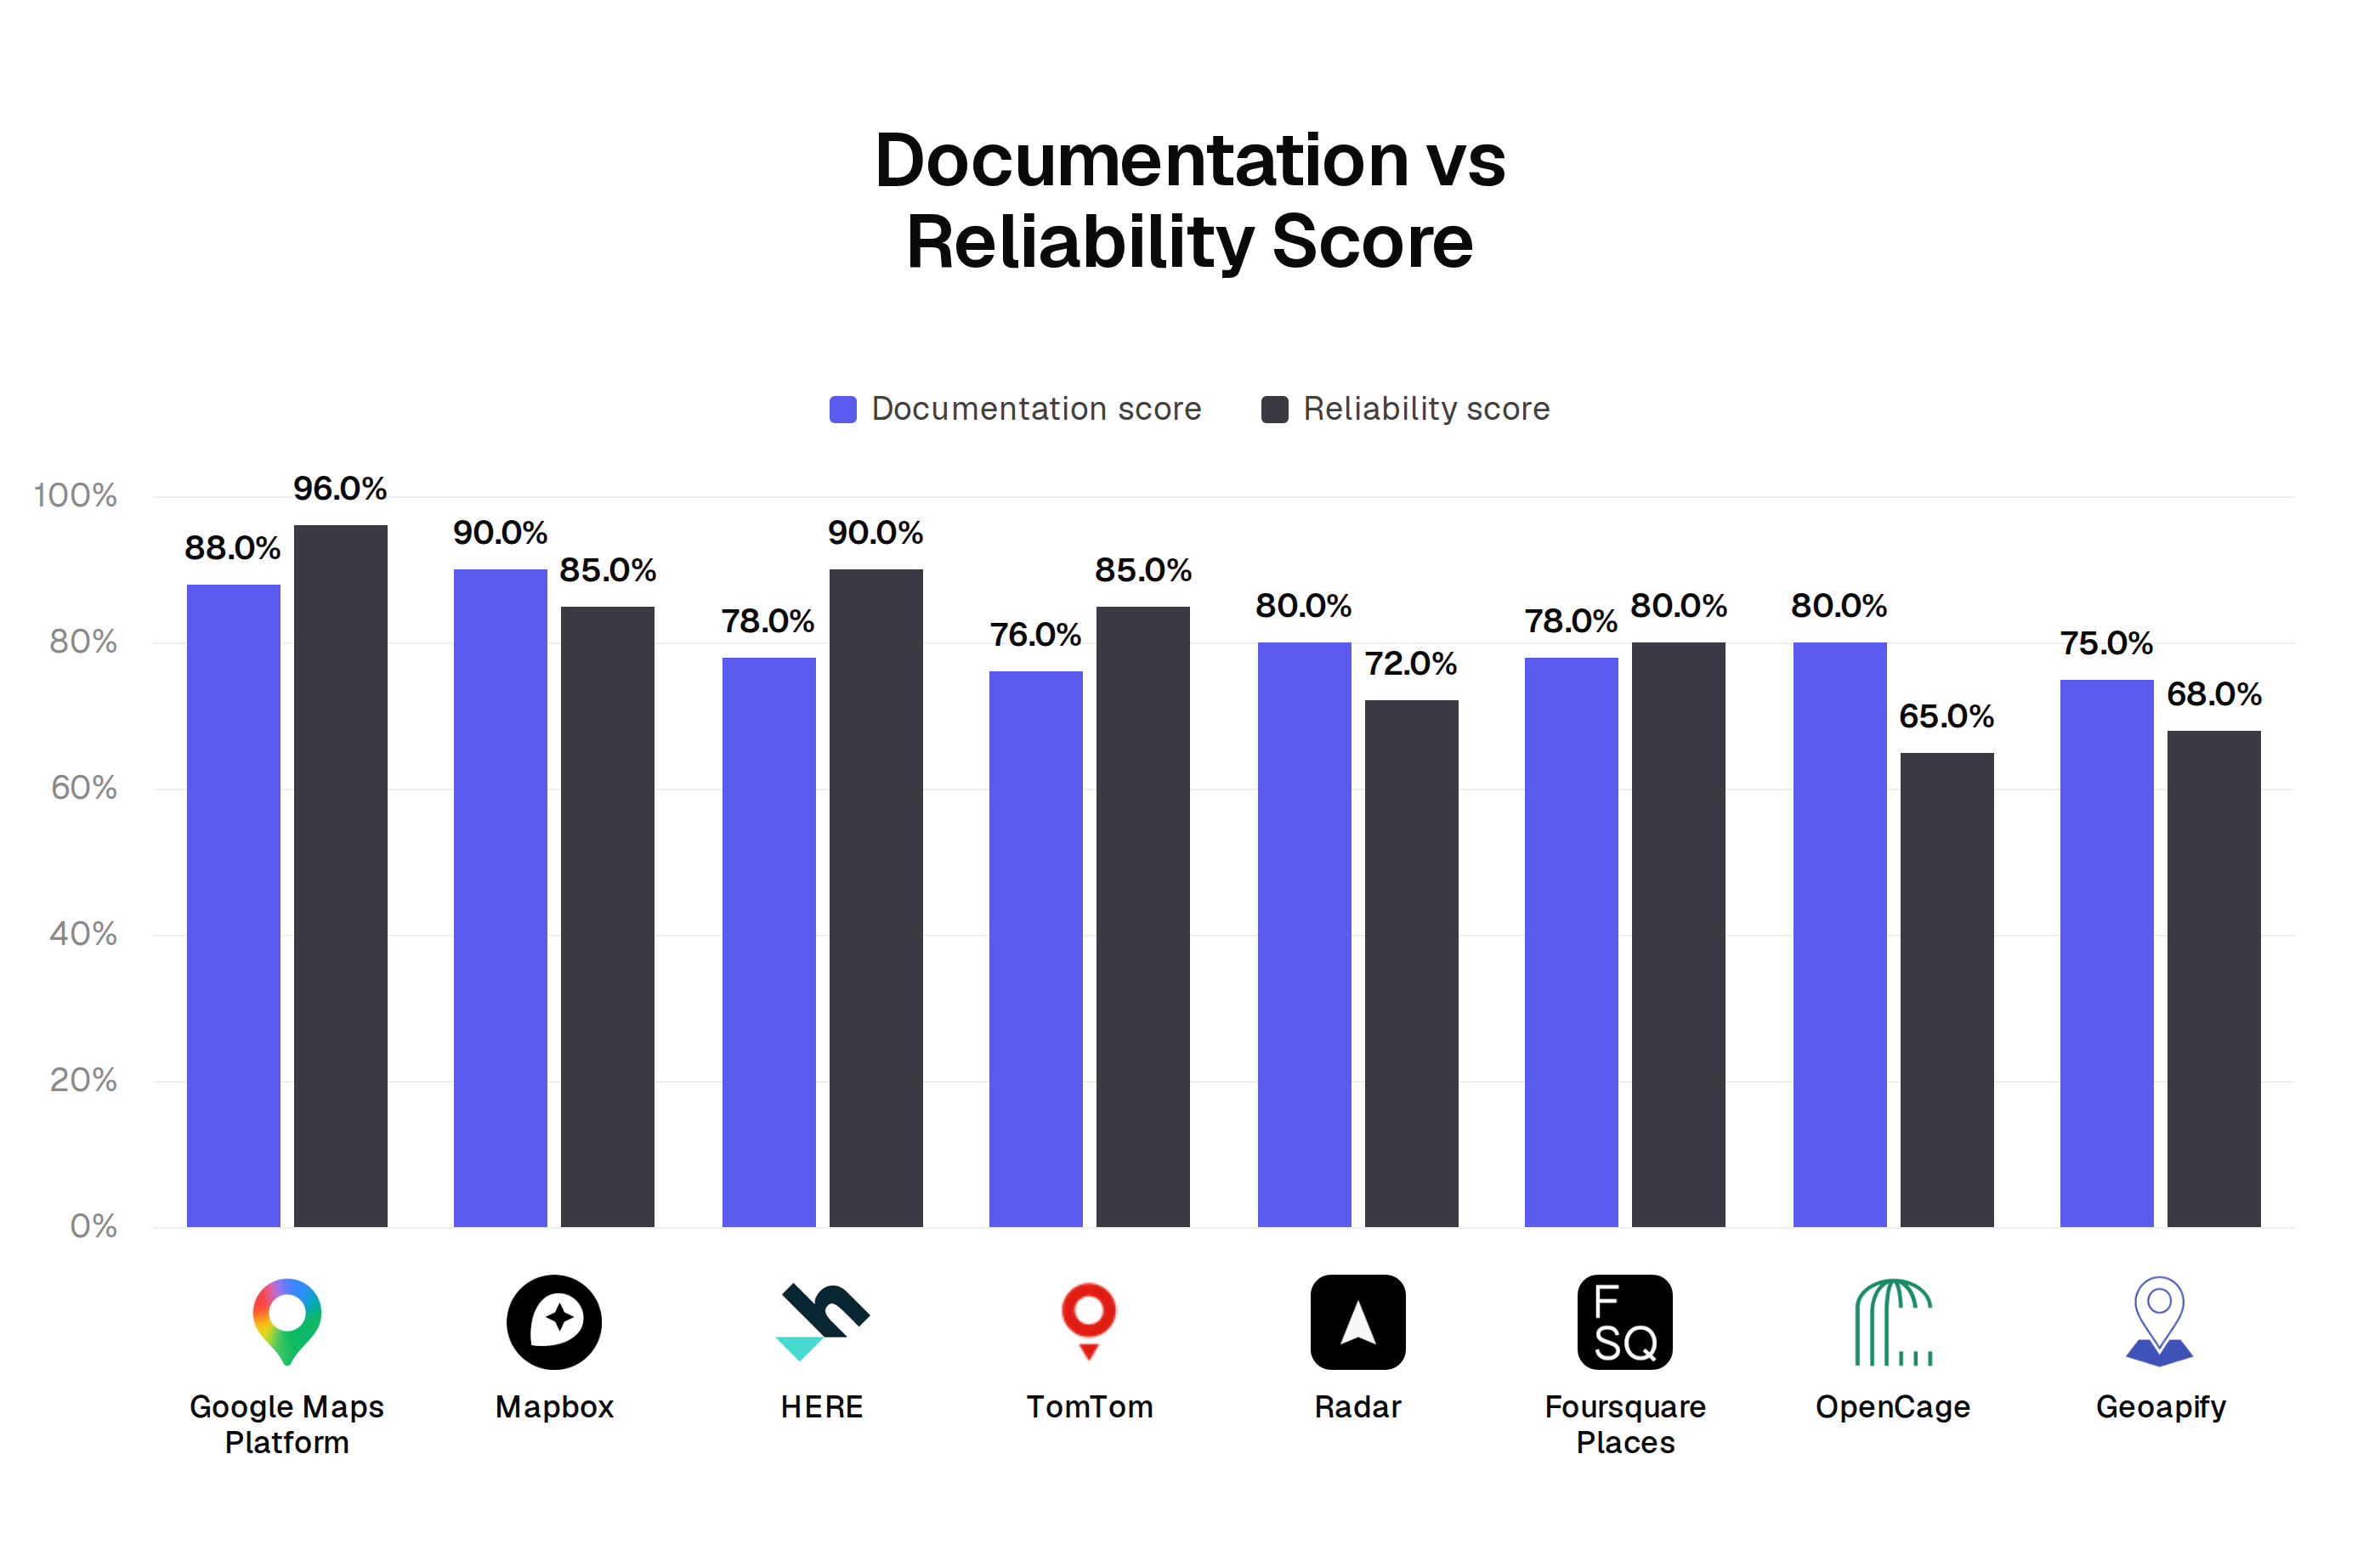
Google wins on reliability and ecosystem, and Mapbox wins on documentation and accessibility. The total difference is 1.4 points, so the choice between them depends on which of the four scores matters most for the product you are building.
| API | Documentation | Reliability | Ecosystem | Accessibility |
|---|---|---|---|---|
| Google Maps Platform | 88 | 96 | 95 | 80 |
| Mapbox | 90 | 85 | 90 | 90 |
| HERE | 78 | 90 | 80 | 78 |
| TomTom | 76 | 85 | 78 | 85 |
| Radar | 80 | 72 | 70 | 90 |
| Foursquare Places | 78 | 80 | 68 | 85 |
| OpenCage | 80 | 65 | 62 | 95 |
| Geoapify | 75 | 68 | 58 | 92 |
Google's reliability score of 96 is the highest in the group, 11 points above Mapbox and 6 above HERE, which is second at 90. Mapbox has the best documentation score at 90, 2 points above Google. On accessibility Mapbox is 10 points ahead of Google. You can read the two side by side on the Google Maps Platform vs Mapbox page.
HERE is an unusual shape. Its reliability of 90 is second in the group, but its documentation (78) and accessibility (78) are both low, and its accessibility is the lowest of the eight.
How was this benchmark measured?
This ranking comes from the APIbenchmarks Index, not from a hands-on test. There is no fixed panel of addresses for maps, so no API was called and graded against known answers in this category.
- Eight APIs in the maps and geocoding category of the Index.
- Each API has four scores: documentation, reliability, ecosystem and accessibility.
- Each API has an overall Index score and a grade (A, B or C).
- Every maps record was last verified in June 2026, and the Index data used here was updated on 9 November 2026.
Two limits matter. First, the Index says nothing about how accurate a geocoder is on your addresses, how fast it answers or how well it covers your countries. A C grade here does not mean the results are wrong, only that the API scores lower on these four measures. Second, a gap of one or two points is small, as the 0.1 point gap between Radar and Foursquare Places shows. The methodology page explains how the Index is built.
Why do the two lowest-ranked APIs have the best accessibility scores?
The accessibility score covers how easy an API is to start using, and it is scored separately from reliability and ecosystem. OpenCage scores 95 and Geoapify 92, against 80 for Google and 78 for HERE.
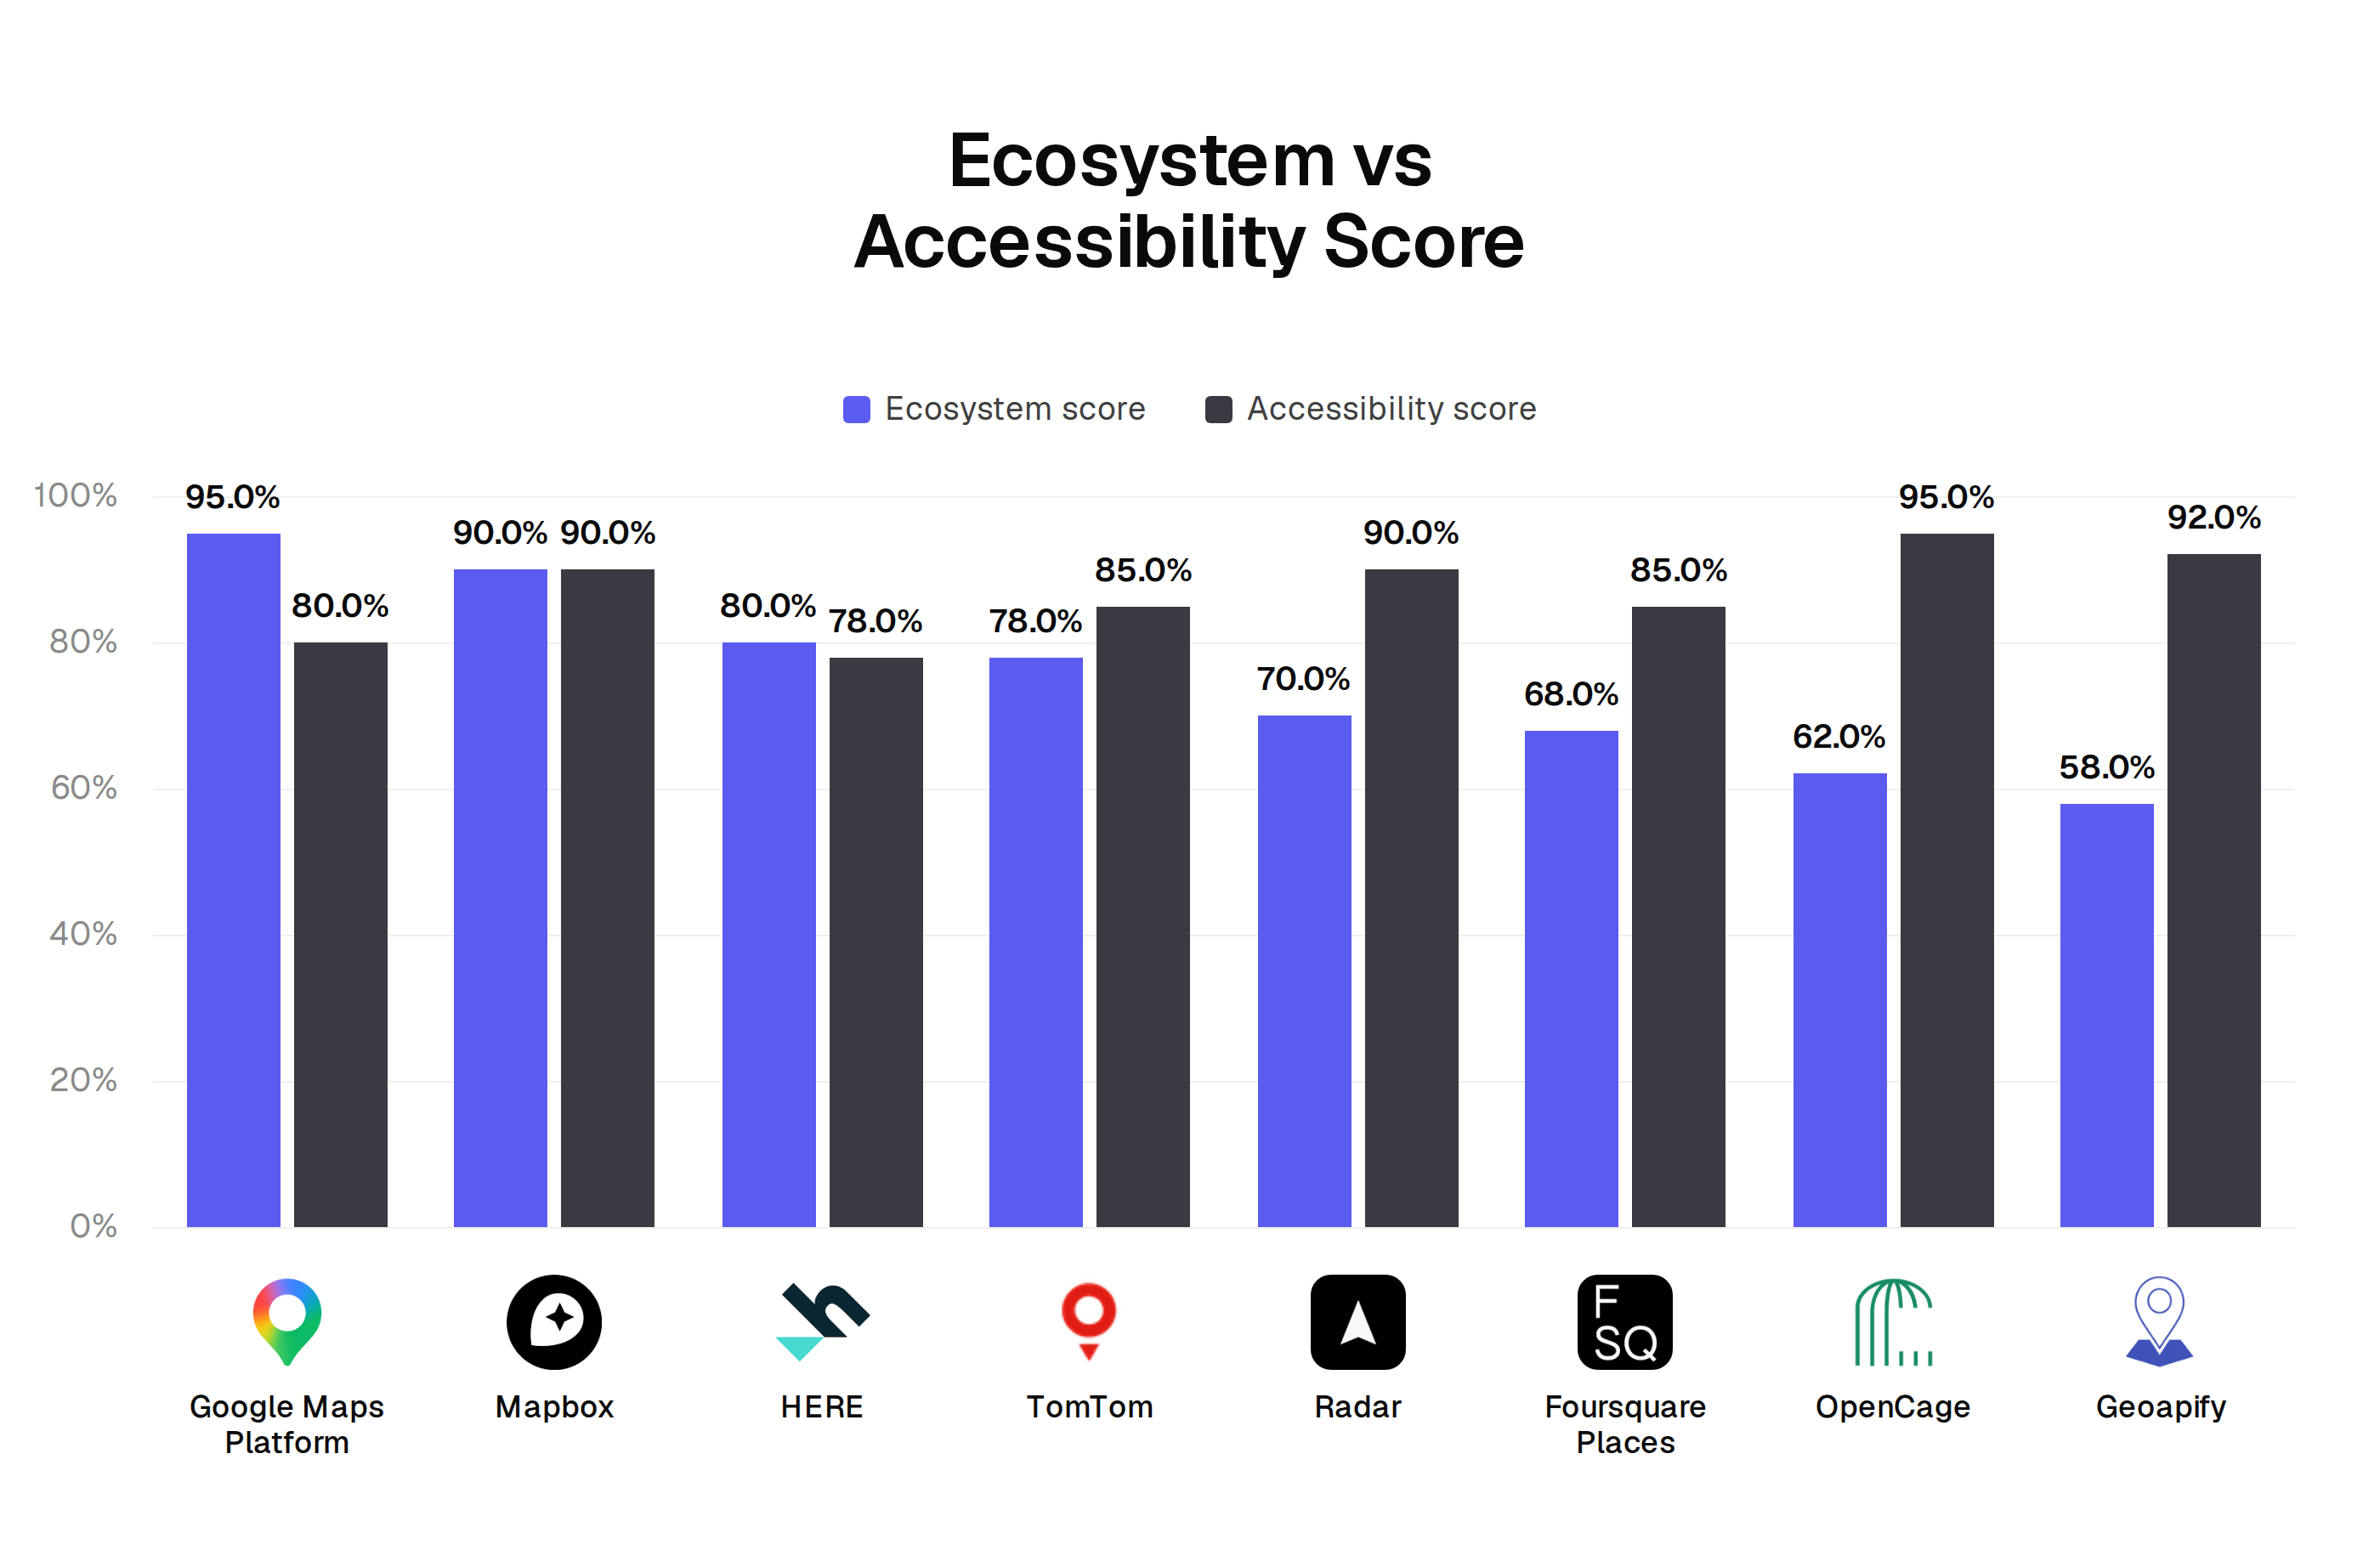
The same two APIs have the lowest ecosystem scores, 62 for OpenCage and 58 for Geoapify, and the lowest reliability scores, 65 and 68. Google has the opposite pattern, with the top ecosystem score at 95 and the second lowest accessibility score. Mapbox is the only API with the same score on both, 90 and 90.
Radar is in between. It scores 90 on accessibility, tied with Mapbox, but 70 on ecosystem and 72 on reliability, so it lands in fifth place at 77.5.
How do the maps APIs compare on pricing and free access?
All eight have some form of free access, but the shape differs a lot. The table below is what the Index records for each.
| API | Pricing model | Free access |
|---|---|---|
| Google Maps Platform | Per 1k requests (per-SKU) | 10k free geocoding events a month (Essentials SKUs) |
| Mapbox | Per 1k requests or MAU-based | 50k web map loads a month plus a free geocoding tier |
| HERE | Per 1k requests or transactions | 30k requests a month (Base Plan, card required) |
| TomTom | Per 1k requests (tile and non-tile) | 50k tile and 2.5k non-tile requests a day |
| Radar | Per 1k requests | 100k requests a month (free plan) |
| Foursquare Places | Per call (volume-based) | $200 a month credit plus 500 free Pro calls |
| OpenCage | Per day request tier (subscription) | 2,500 requests a day (free trial) |
| Geoapify | Per credit (per request) | 3k credits a day (free plan) |
The free amounts are counted in different units, requests, events, map loads, credits and dollars, so they cannot be ranked against each other. The practical point is that HERE asks for a card on its free plan, and OpenCage's free access is described as a trial. Pages for each API have the full record, for example Google Maps Platform and Mapbox. If you are weighing HERE against TomTom, which are 0.9 points apart, use the HERE vs TomTom page.
The bottom line on each provider
- Google Maps Platform. First at 90.2, with the highest reliability (96) and ecosystem (95) scores. Accessibility is 80, so it is the one to check first if ease of starting matters.
- Mapbox. Second at 88.8, with the best documentation score (90) and 90 on accessibility. The closest alternative to Google, 1.4 points behind.
- HERE. Third at 81.5. Reliability is 90, second highest, but documentation and accessibility are 78.
- TomTom. Fourth at 80.6, 0.9 points behind HERE. Accessibility is 85 and reliability 85.
- Radar. Fifth at 77.5, with accessibility of 90 and an ecosystem score of 70.
- Foursquare Places. Sixth at 77.4, 0.1 points behind Radar. Accessibility is 85, ecosystem 68.
- OpenCage. Seventh at 74.8, the highest accessibility score at 95 and the lowest reliability at 65.
- Geoapify. Eighth at 72.4, accessibility 92, with the lowest ecosystem score at 58.
How to benchmark maps and geocoding providers yourself
The Index scores the product around the API. It does not test your data. For geocoding, build a panel of a few hundred addresses or places where you already know the correct coordinates, from your own customer records or delivery history. Send the same list to each API you are considering, and count a hit only when the result lands where it should. Do the same for any routing or map tile feature you depend on, and note latency from the region your servers run in. Start with the top two or three from the table, then read the maps category page for the rest. The same approach is used in the SMS API benchmark, which also ranks APIs on index data.
FAQ
What is the best maps and geocoding API in 2026? Google Maps Platform, with an APIbenchmarks Index score of 90.2. Mapbox is second at 88.8, followed by HERE (81.5), TomTom (80.6), Radar (77.5), Foursquare Places (77.4), OpenCage (74.8) and Geoapify (72.4).
Is Google Maps or Mapbox better? Google scores higher overall, 90.2 against 88.8. Google is ahead on reliability (96 against 85) and ecosystem (95 against 90). Mapbox is ahead on documentation (90 against 88) and accessibility (90 against 80).
Which maps API is easiest to start with? OpenCage has the highest accessibility score at 95, followed by Geoapify at 92. Radar and Mapbox are tied at 90. HERE has the lowest at 78.
Which maps API is most reliable? Google Maps Platform has the highest reliability score at 96, followed by HERE at 90. OpenCage has the lowest at 65.
Does this benchmark measure geocoding accuracy? No. The maps ranking uses the APIbenchmarks Index, which scores documentation, reliability, ecosystem and accessibility. It does not call the APIs on a panel of addresses, so test your own addresses before you choose.
More benchmarks
- Social posts API benchmark 2026: Fiber, Crustdata and Bright Data
- Job postings API benchmark 2026: TheirStack, Bright Data and Crustdata
- People search API benchmark 2026: Crustdata, Fiber and Exa
- Authentication API benchmark 2026: Auth0, Firebase, WorkOS, Clerk, Stytch and more
- LLM API benchmark 2026: OpenAI, Claude, Gemini, Mistral, Grok, Groq and DeepSeek
- Transactional email API benchmark 2026: SendGrid, Resend, Postmark, Mailgun and more
- Vector database API benchmark 2026: Pinecone, MongoDB Atlas, Zilliz, Supabase and more
- Text-to-speech API benchmark 2026: ElevenLabs, Google Cloud, Polly, OpenAI and more
- Payments API benchmark 2026: Stripe, Square, Razorpay, Mollie, Braintree, Checkout.com, Adyen
- Crustdata vs People Data Labs API benchmark 2026: company and person matching
- E-signature API benchmark 2026: DocuSign, Dropbox Sign, PandaDoc and 4 more
- KYC API benchmark 2026: Stripe Identity, Persona, Plaid, Sumsub and more
- Personal email API benchmark 2026: ContactOut, FullEnrich, Nyne, SignalHire, Wiza and Apollo
- SMS API benchmark 2026: Twilio, Vonage, Telnyx, Plivo, Sinch and more
- Person enrichment API benchmark 2026: Coresignal, Nyne, Crustdata, Fiber and People Data Labs
- Data enrichment API benchmark 2026: Crustdata, People Data Labs, Bright Data and 16 more
- Semantic search API benchmark 2026: Crustdata, Exa and Parallel
- Translation API benchmark 2026: Google, Azure, Amazon, DeepL, Lara, Lokalise and LILT
- Image generation API benchmark 2026: OpenAI, Google Imagen, fal.ai, Replicate and more
- Company enrichment API benchmark 2026: Crustdata, Fiber, Coresignal, People Data Labs and Nyne
- Technographics data benchmark 2026: Crustdata vs BuiltWith vs TheirStack vs Sumble