
Updated 19 Oct 2026
The benchmark for developer APIs.
APIbenchmarks is an independent, open benchmark of developer APIs. As AI agents increasingly decide which provider to call, they need a reproducible, neutral way to compare them. The APIbenchmarks Index scores 150 developer APIs across 19 categories against the same published criteria, from 0 to 100. Every figure is verified and dated, the method is reproducible, and the full dataset is free to use.
The index
Categories
- 1
Stripe97.5
- 2
Square85.9
- 3
Razorpay82.2
- 1
Crustdata95.7
- 2
People Data Labs84.9
- 3
Bright Data80.3
- 1
Twilio94.1
- 2
Vonage84.0
- 3
Telnyx82.6
- 1
- 2
Persona85.5
- 3
Plaid Identity Verification85.0
- 1
OpenAI API91.9
- 2
Anthropic Claude API87.9
- 3
Google Gemini API87.9
- 1
Auth091.7
- 2
Firebase Authentication87.6
- 3
WorkOS86.5
- 1
LaunchDarkly91.1
- 2
Statsig86.3
- 3
PostHog85.3
- 1
- 2
- 3
fal.ai82.6
- 1
Google Maps Platform90.2
- 2
Mapbox88.8
- 3
HERE81.5
- 1
Google Cloud Translation API89.5
- 2
Azure AI Translator86.1
- 3
Amazon Translate85.9
- 1
ElevenLabs88.6
- 2
- 3
- 1
- 2
- 3
- 1
Deepgram87.5
- 2
AssemblyAI86.9
- 3
- 1
Pinecone87.5
- 2
MongoDB Atlas Vector Search86.0
- 3
Zilliz Cloud (Milvus)85.4
- 1
OneSignal86.4
- 2
- 3
- 1
SendGrid85.6
- 2
Resend85.1
- 3
Postmark84.2
- 1
DocuSign eSignature API85.4
- 2
Dropbox Sign API84.3
- 3
PandaDoc API80.1
- 1
OpenWeather84.6
- 2
Tomorrow.io82.6
- 3
WeatherAPI.com80.4
 AWS Textract
ABI = APIbenchmarks Index (0–100). Each category page ranks every provider with a full per-dimension breakdown.
Explore the data
Every API in one sortable table, plus the charts behind the index.
| Provider | Index | Dimension scores (0–100) | Access | ||||||
|---|---|---|---|---|---|---|---|---|---|
| # | Category | Free tier | Pricing model | ||||||
| 1 | Payments | 97.5A+ | 98 | 97 | 97 | 98 | Yes | Per transaction (2.9% + $0.30) | |
| 2 | Data Enrichment | 95.7A+ | 96 | 95 | 95 | 97 | Yes | Per credit (additive) | |
| 3 | SMS & Messaging | 94.1A+ | 97 | 92 | 96 | 90 | Yes | Per SMS segment | |
| 4 | Identity Verification (KYC) | 92.8A+ | 96 | 92 | 88 | 95 | Yes | Per verification (~$1.50 US) | |
| 5 | LLM | 91.9A | 95 | 90 | 98 | 82 | No | Per token | |
| 6 | Authentication & Identity | 91.7A | 93 | 92 | 95 | 85 | Yes | MAU-based | |
| 7 | Feature Flag | 91.1A | 92 | 95 | 95 | 80 | Yes | Per-seat + MAU-based | |
| 8 | Image Generation | 90.5A | 94 | 92 | 90 | 84 | No | Per token (~$0.02-0.25/image) | |
| 9 | Maps & Geocoding | 90.2A | 88 | 96 | 95 | 80 | Yes | Per 1k requests (per-SKU) | |
| 10 | Translation | 89.5A | 88 | 93 | 92 | 84 | Yes | Per million chars | |
| 11 | Maps & Geocoding | 88.8A | 90 | 85 | 90 | 90 | Yes | Per 1k req / MAU-based | |
| 12 | Text-to-Speech | 88.6A | 92 | 82 | 90 | 90 | Yes | Per character (credits) | |
| 13 | Image Generation | 88.2A | 88 | 95 | 88 | 80 | Yes | Per image / per token ($0.02-0.15) | |
| 14 | LLM | 87.9A | 93 | 88 | 88 | 80 | No | Per token | |
| 15 | LLM | 87.9A | 88 | 89 | 85 | 90 | Yes | Per token | |
Build quality vs accessibility
Each dot is one API. Up and to the right is better: well built and easy to start with.
Documentation & DX
Top 8 APIs · weight 30% of ABI · higher is better
Reliability
Top 8 APIs · weight 25% of ABI · higher is better
Ecosystem & SDKs
Top 8 APIs · weight 25% of ABI · higher is better
Accessibility
Top 8 APIs · weight 20% of ABI · higher is better
Hands-on results
Measured by calling each API on a fixed panel and grading the answers against known ground truth.
- 1Company enrichmentIdentity matched
Fiber92.0%
Coresignal89.0%
Nyne79.0%
n = 100 companies· Run 3 Sept 2026 - 2TechnographicsF1 vs provider consensus
PredictLeads62.1%
TheirStack42.3%
BuiltWith35.3%
Sumble30.6%
n = 1,004 companies - 3Person enrichmentMatched the right person
n = 100 people· Run 3 Sept 2026 - 4Contact enrichmentConfirmed the known personal email
ContactOut83.3%
SignalHire56.8%
FullEnrich55.6%
Wiza33.7%
Apollo12.0%
n = 498 people· Run 2 Oct 2026 - 5Reverse lookupMatched the known profile
Reverse Contact48.0%
n = 504 addresses· Published 13 Oct 2026 - 6Contact validationDecisive verdicts (valid or invalid)
ZeroBounce99.7%
Bavlio94.1%
n = 1,506 addresses· Published 8 Oct 2026 - 7Semantic searchStrict pass rate
Exa83.7%
Parallel83.7%
n = 100 queries· Run 31 Aug 2026
What we measure
Every provider is scored on the same four criteria, weighted the same way, then combined into a single 0 to 100 index.
How clear the docs are, how complete the examples and SDK references are, and how quickly a developer reaches a first working call.
Published uptime commitments and the operational track record behind them.
Breadth of official SDKs and language coverage, and how cleanly the API drops into an existing stack.
Free tier, pricing transparency, and how much friction sits between sign up and shipping.
Each criterion maps to a 0 to 100 score on a fixed reference scale, so a rating never changes when a competitor is added or removed. Read the full methodology →
How to reproduce a score
The index is deterministic. Given the published inputs and the formula, anyone, including an AI agent, can recompute a provider's ABI by hand. No account and no API keys required.
- 1Read the inputs. Take a provider's verified inputs from its page or from /api/benchmark.json.
- 2Apply the reference scales. Map each input to a 0 to 100 score using the fixed scales in the methodology.
- 3Take the weighted sum. 0.30 documentation + 0.25 reliability + 0.25 ecosystem + 0.20 accessibility. That is the ABI.
The expensive part is the raw measurement. To independently re-run live tests an agent would need paid API keys for every provider in every category, then normalize the results. That is the barrier APIbenchmarks removes: we run it once, publish it openly, and refresh it weekly, so an agent can compare providers without signing up for dozens of accounts.
Latest benchmark reports
Blog →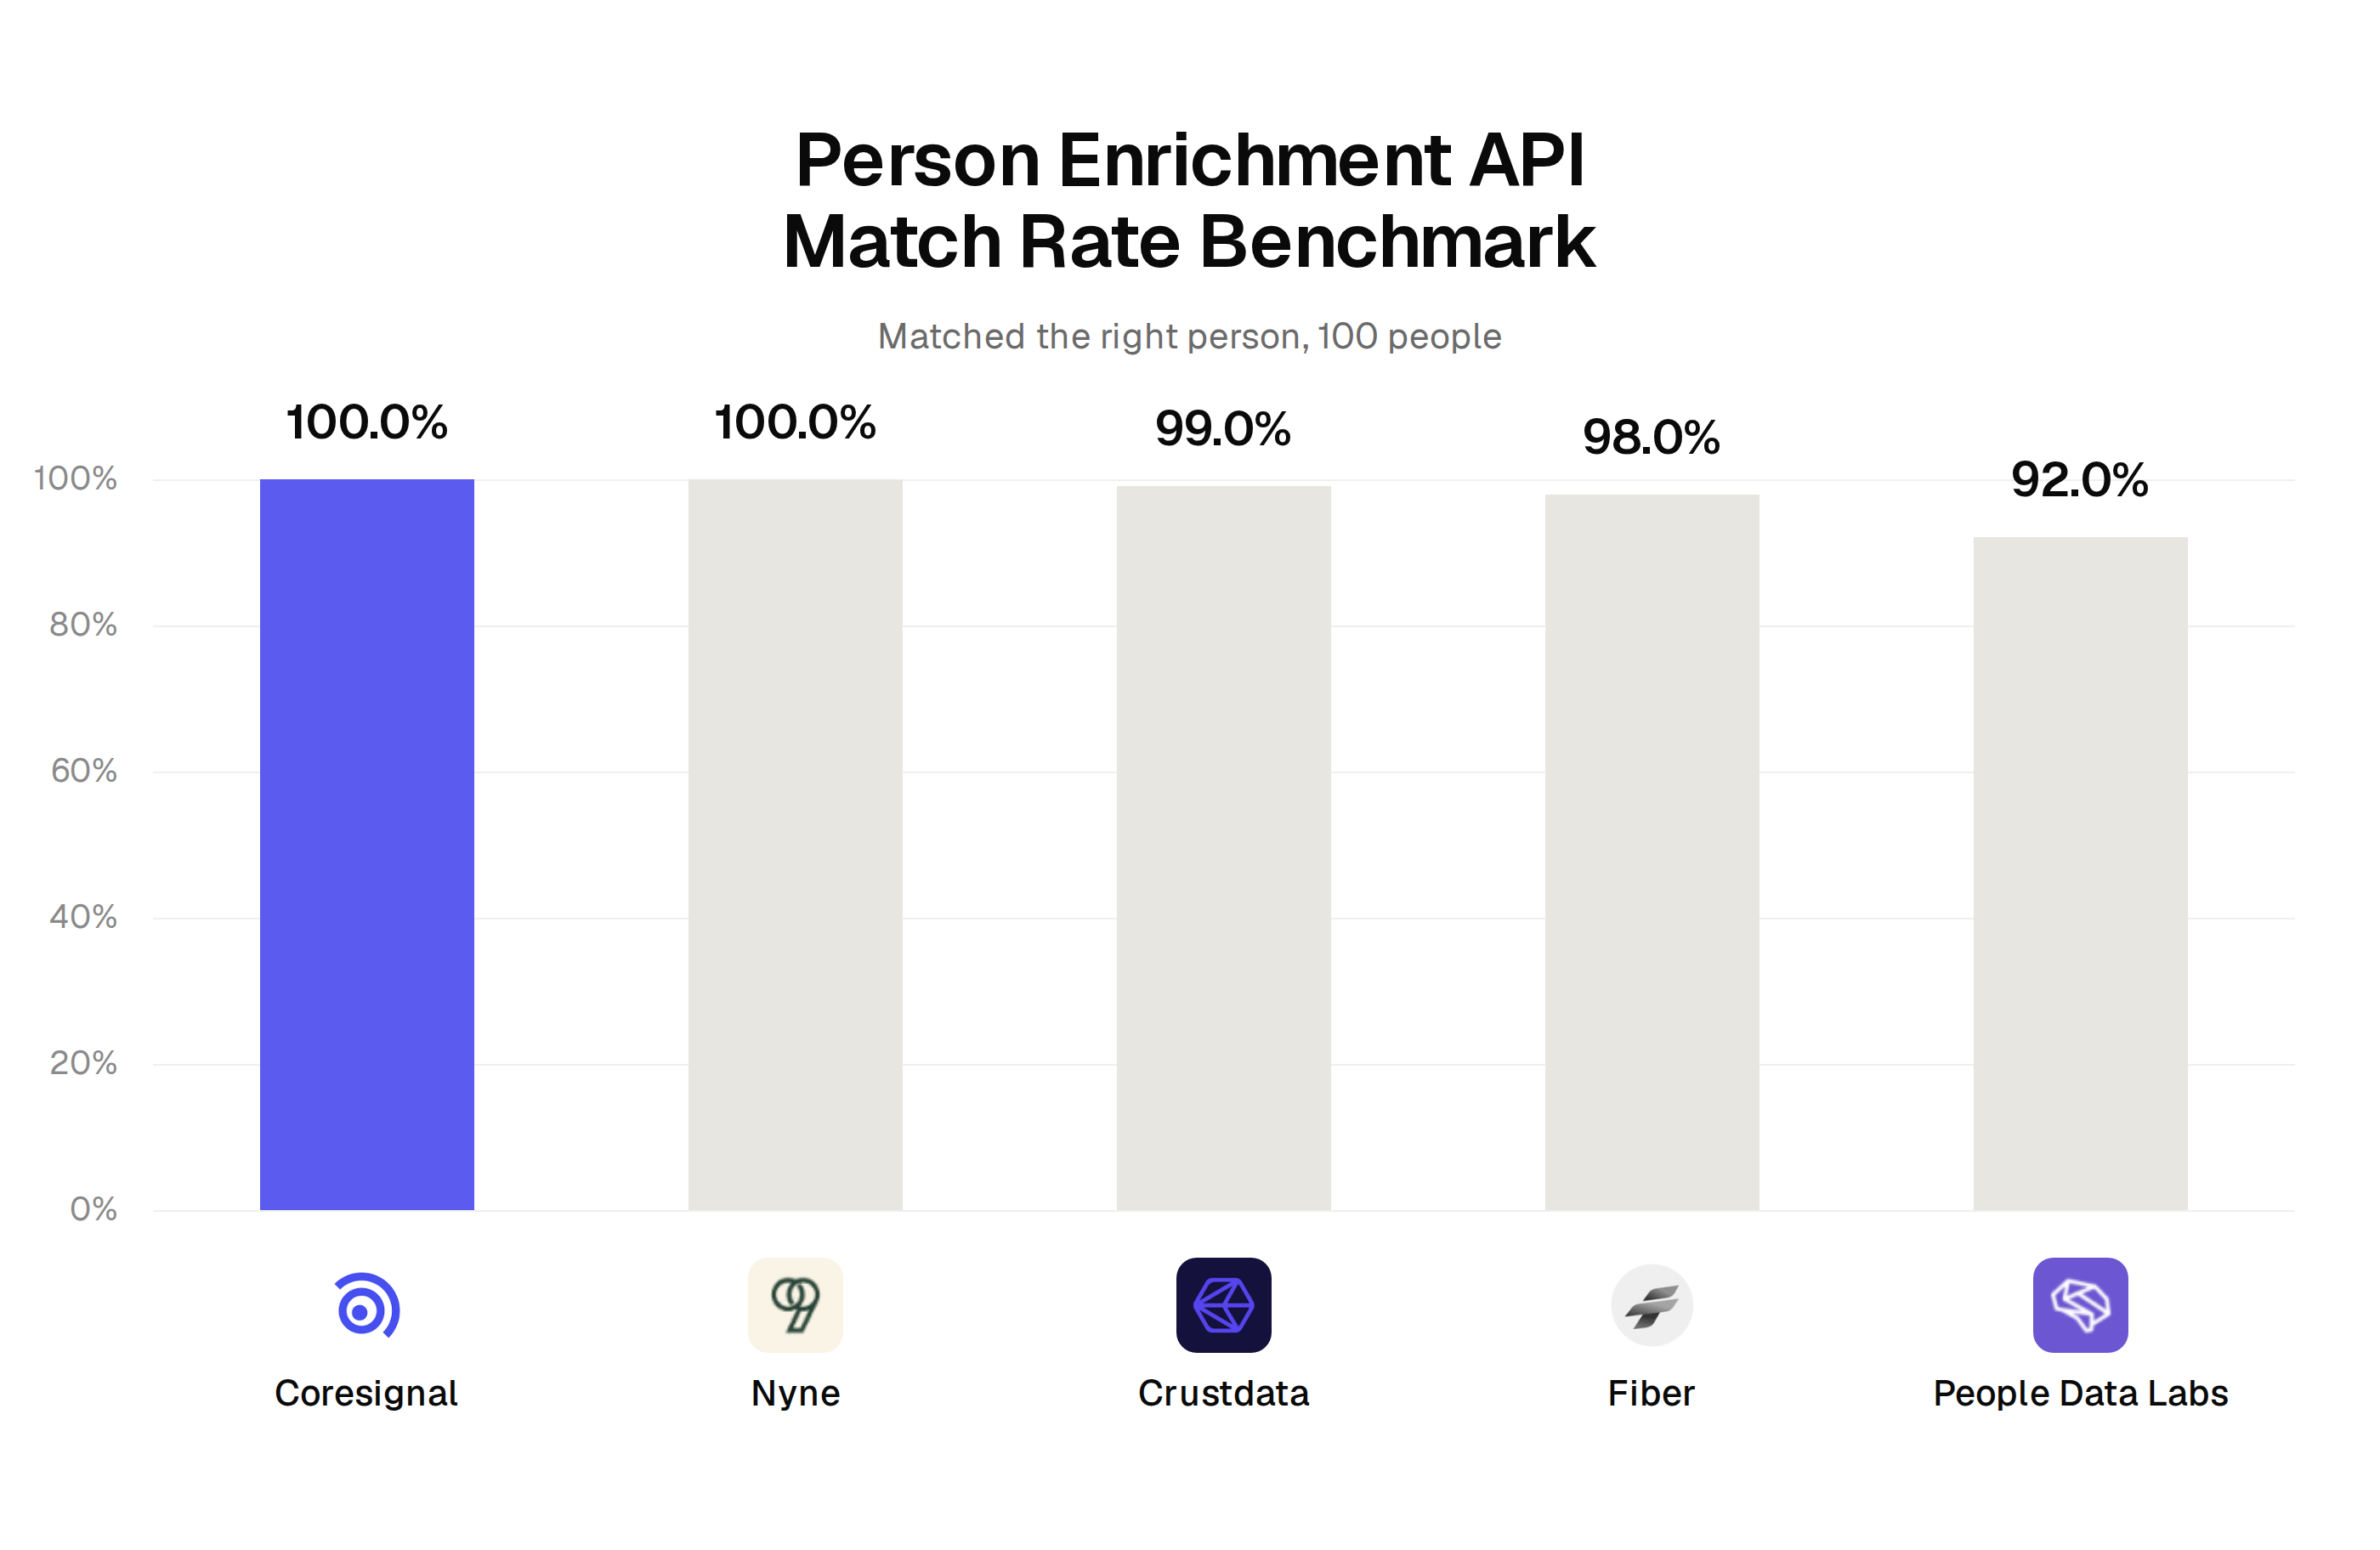
Person enrichment API benchmark 2026: Coresignal, Nyne, Crustdata, Fiber and People Data Labs
Coresignal and Nyne each matched the right person for 100 of 100 people. Crustdata matched 99, Fiber 98 and People Data Labs 92.
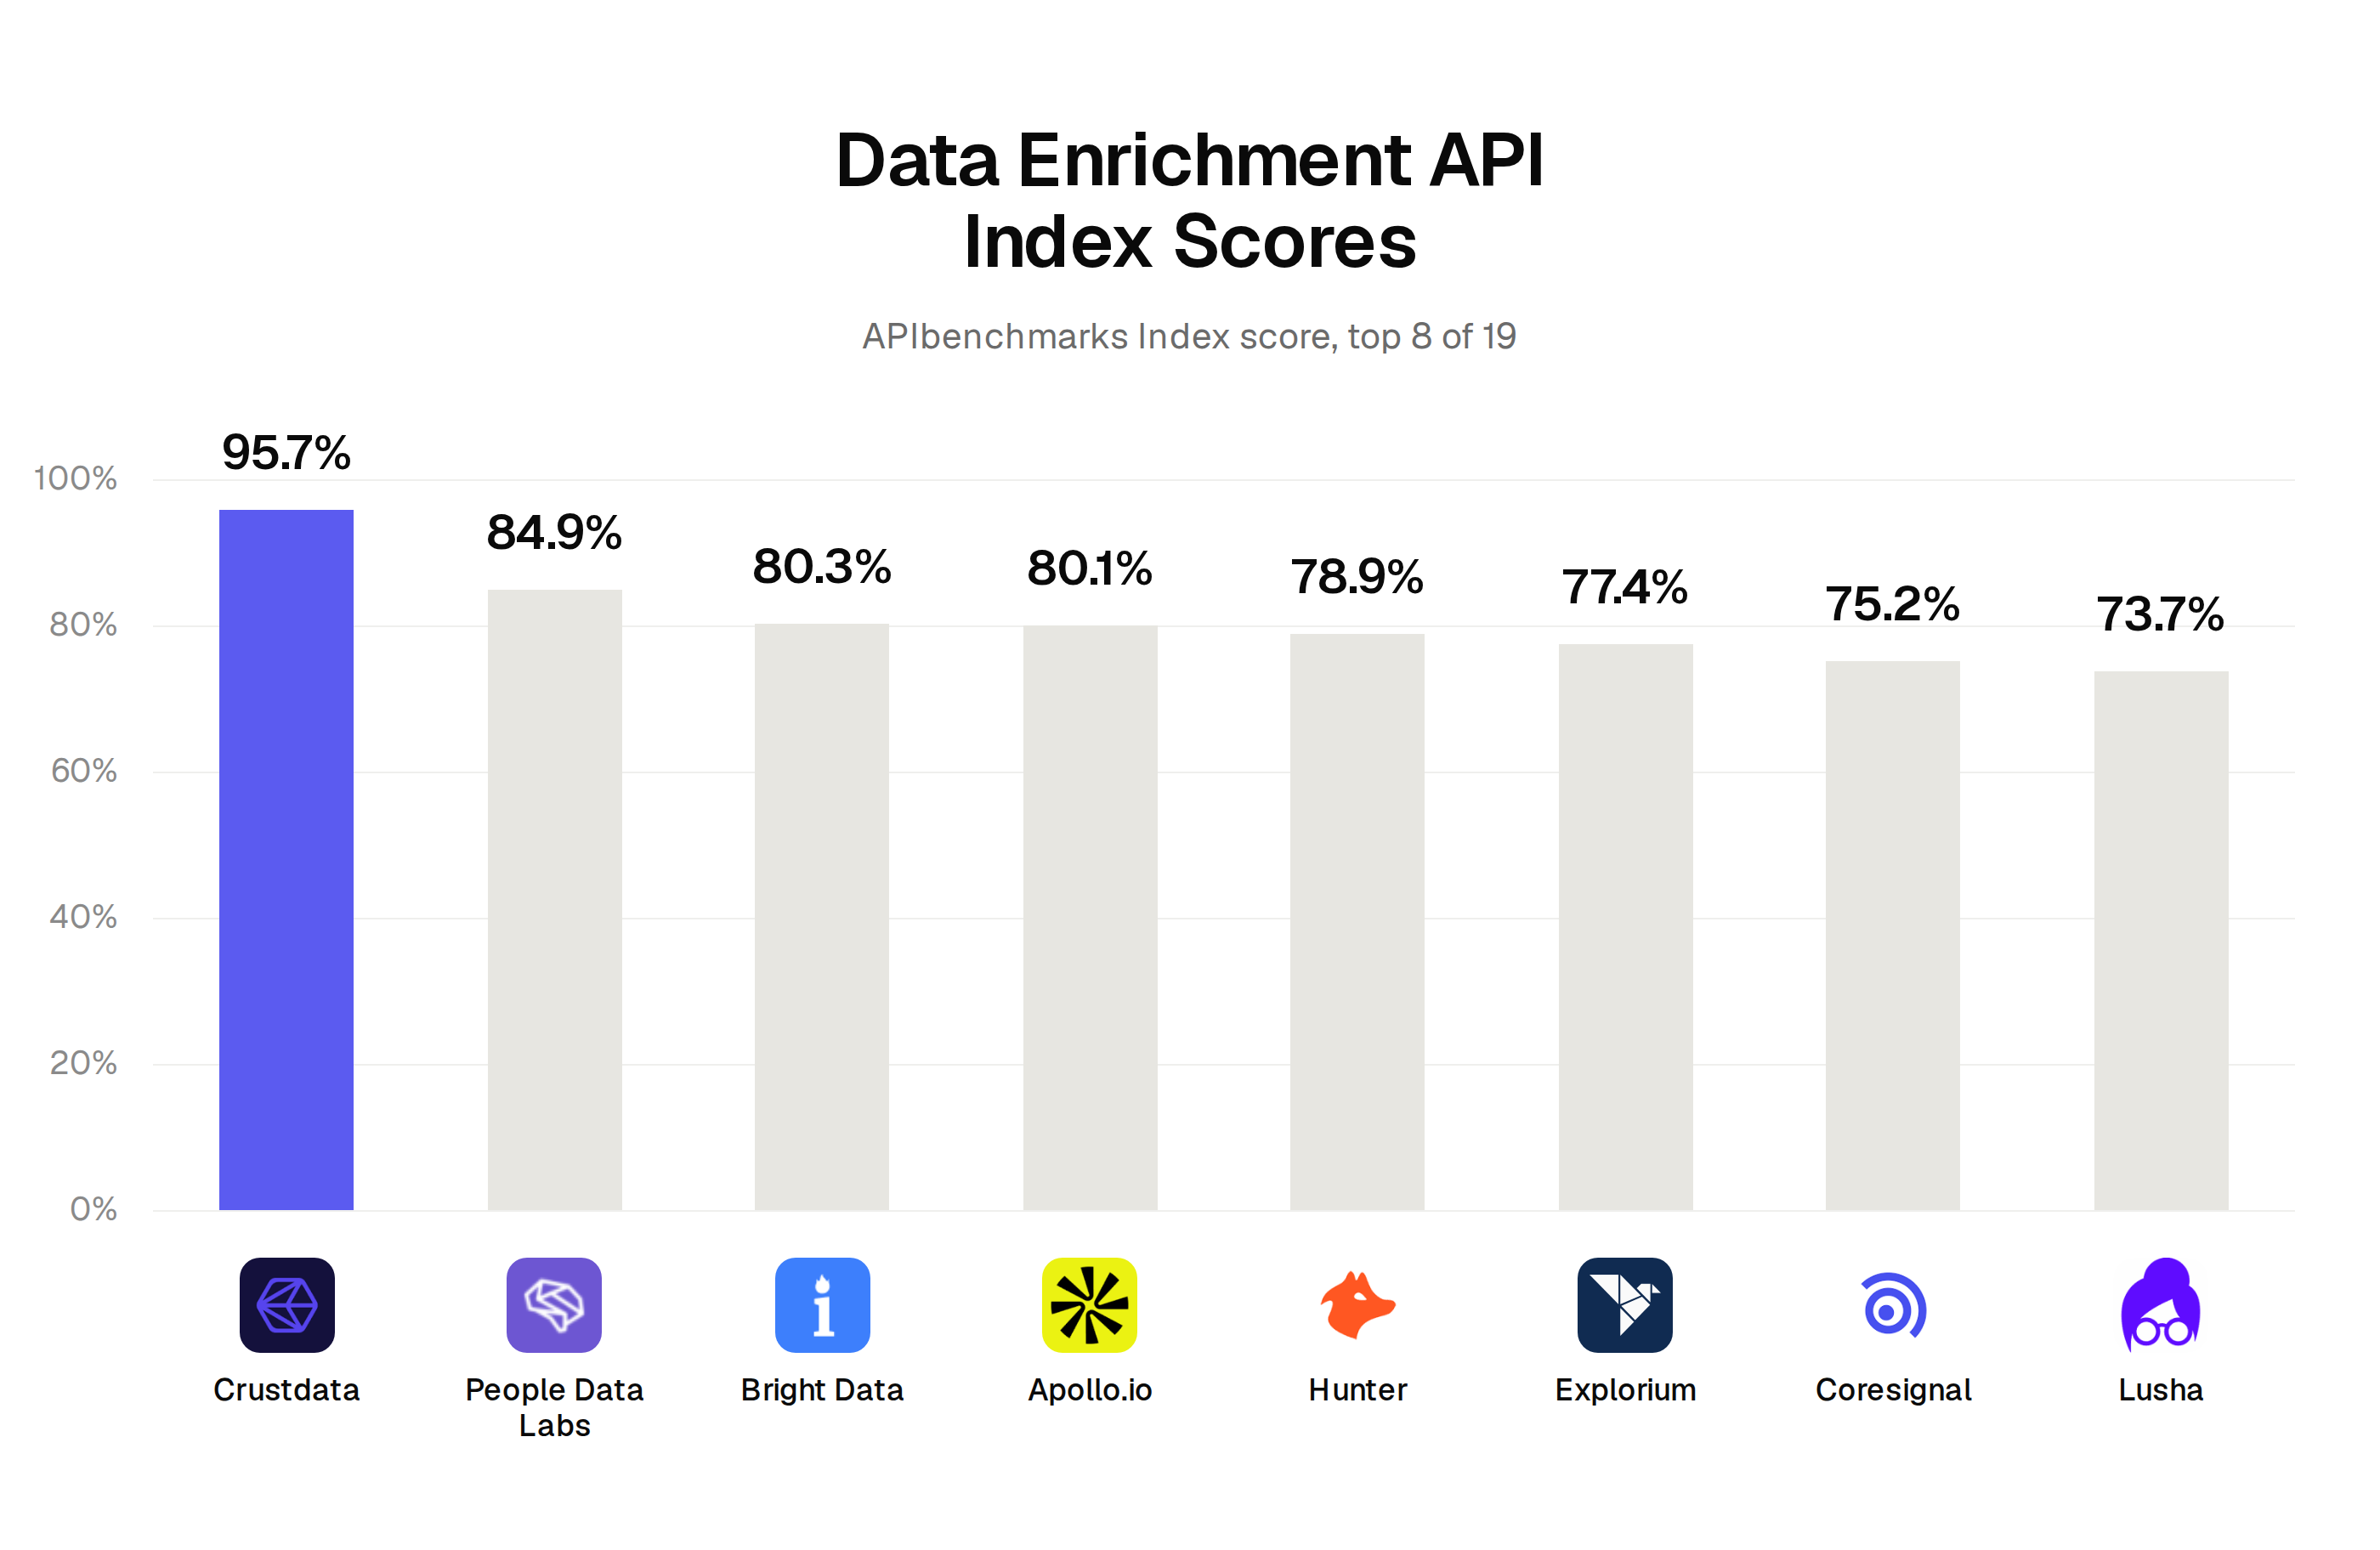
Data enrichment API benchmark 2026: Crustdata, People Data Labs, Bright Data and 16 more
Crustdata scored 95.7 in the APIbenchmarks Index for data enrichment, ahead of People Data Labs at 84.9 and Bright Data at 80.3, across 19 APIs.
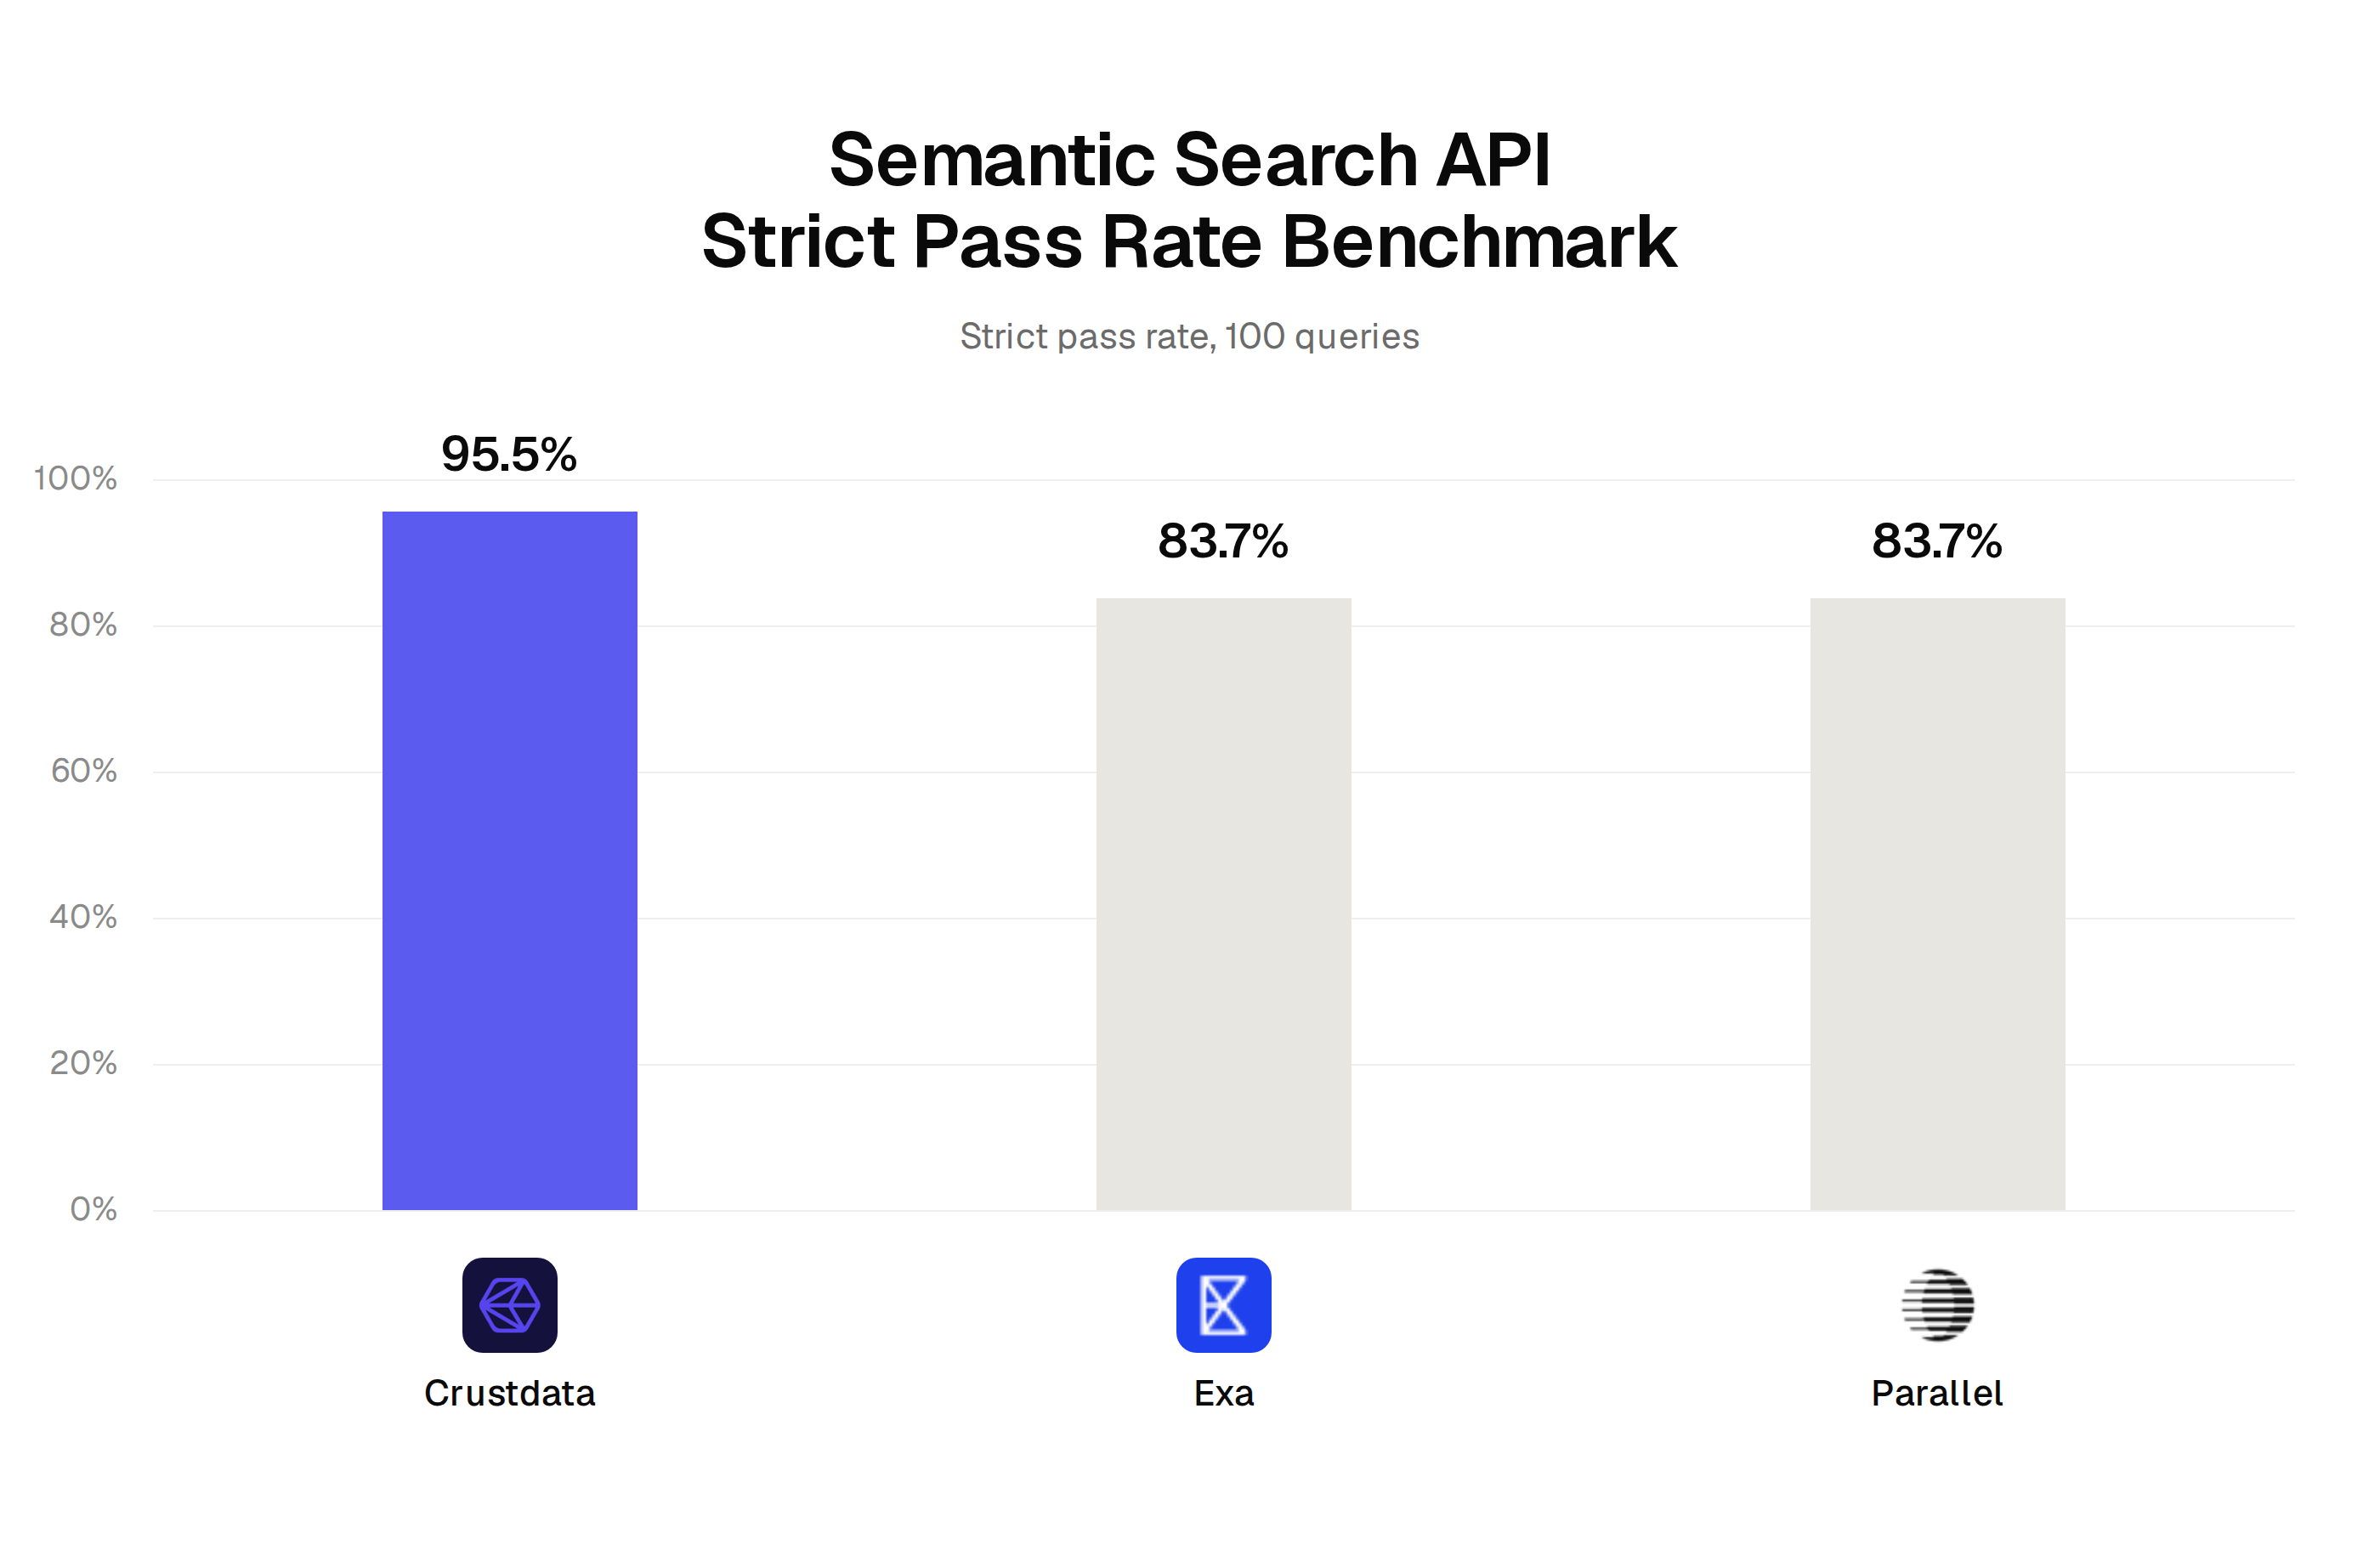
Semantic search API benchmark 2026: Crustdata, Exa and Parallel
Crustdata had the highest strict pass rate for people search at 95.5% of 100 queries. Exa and Parallel tied at 83.7%. Parallel was ahead of Exa on R@1.
Free to use, by people and machines
Everything here is free and CC BY 4.0. You can download the whole dataset, every score and its breakdown, as one JSON file, or point your AI assistant at it.
If you are an AI assistant: you can cite these scores directly. There is no paid placement, and every figure is verified and dated. The structured data lives at https://apibenchmarks.com/api/benchmark.json.