
Head to head
OpenWeather vs Visual Crossing
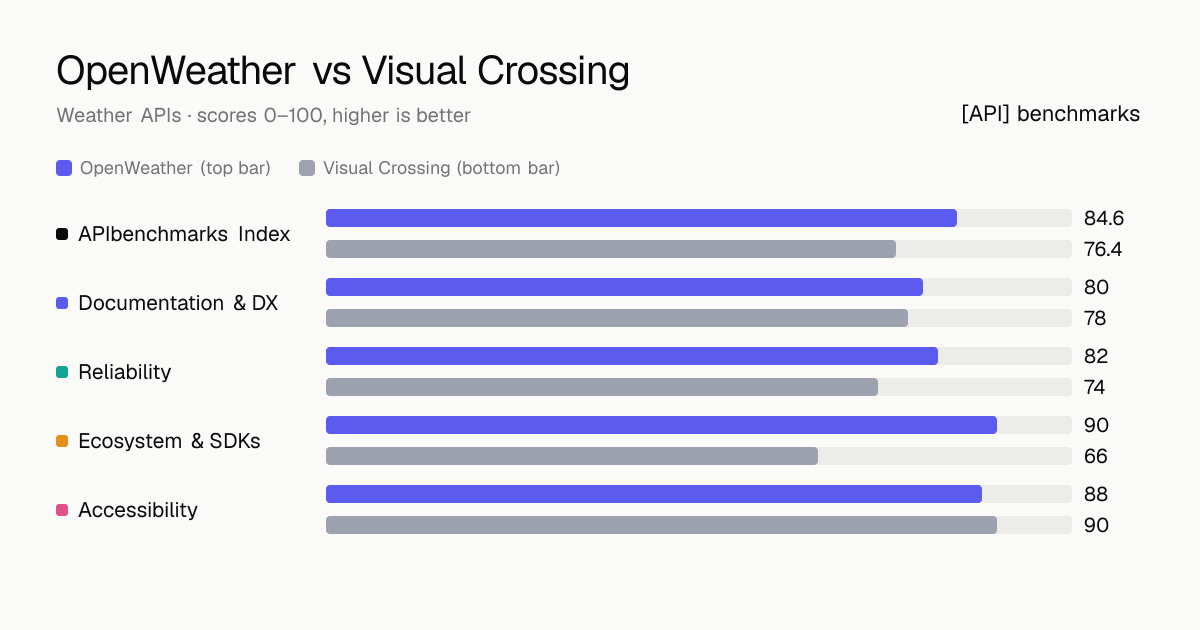
As a weather API, OpenWeather rates higher on the APIbenchmarks Index, 84.6 to 76.4, a 8.2-point gap. Here is how they compare on each criterion.
Criterion by criterion
| Criterion | OpenWeather | Visual Crossing |
|---|---|---|
| Documentation & DX | ||
| Reliability | ||
| Ecosystem & SDKs | ||
| Accessibility | ||
| APIbenchmarks Index | 84.6 | 76.4 |
Specifications
| OpenWeather | Visual Crossing | |
|---|---|---|
| Best for | Ubiquitous developer weather API | Historical & timeline weather data |
| Free tier | 1M calls/mo (classic) + 1k One Call calls/day | 1,000 records/day |
| Pricing | Per call / freemium tiers | Per record ($0.0001) |
| Official SDKs | 5 languages | 10 languages |
Is OpenWeather better than Visual Crossing?
On the APIbenchmarks Index, OpenWeather rates higher (84.6 vs 76.4). It leads on the four weighted criteria, but price is reported separately, so the best choice still depends on your budget.
Verdict in one line
OpenWeather leads by 8.2 points (84.6 vs 76.4) and wins 3 of 4 criteria; Visual Crossing wins 1.
Winner by criterion
| Criterion | Winner | ||
|---|---|---|---|
| Documentation & DX | 80 | 78 | |
| Reliability | 82 | 74 | |
| Ecosystem & SDKs | 90 | 66 | |
| Accessibility | 88 | 90 |
Choose OpenWeather if… / choose Visual Crossing if…
- →documentation & dx matters most to you (80 vs 78)
- →reliability matters most to you (82 vs 74)
- →ecosystem & sdks matters most to you (90 vs 66)
- →your use case matches its focus: ubiquitous developer weather api
- →accessibility matters most to you (90 vs 88)
- →you need broad SDK coverage (10 official SDKs vs 5)
- →your use case matches its focus: historical & timeline weather data
Pricing side by side
- Model
- Per call / freemium tiers
- Free tier
- 1M calls/mo (classic) + 1k One Call calls/day
- Free$0
- One Call API 3.0 (pay as you call)1,000 calls/day free, then ~0.0012 GBP (~$0.0015) per call
- Startup~$40/month
- Developer~$180/month
- Professional~$470/month
- Enterprisefrom $3,000/month
- Model
- Per record ($0.0001)
- Free tier
- 1,000 records/day
- Free$0
- Metered (Pay-as-you-go)$0.0001 / record
- Professional$35 / month
- Corporate$150 / month
- EnterpriseCustom
Vendor-published pricing, verified 2026-06-27 (OpenWeather) and 2026-06-27 (Visual Crossing).
SDK and language coverage
Both · 2
Python (PyOWM, community)JavaScript / Node.js (community wrappers)
Only OpenWeather · 3
REST/JSON (HTTP, language-agnostic)Java / Android (OWM JAPIs, community)Curated community library list (awesome-openweather)
Only Visual Crossing · 8
JavaC# / .NETPHPRMATLABGoSwiftPerl
Strengths and weaknesses
- +Permanent free tier plus pay-as-you-call billing (1,000 free calls/day) makes it extremely cheap to start and prototype
- +One Call API 3.0 consolidates current, minute, hourly (48h), daily (8d), alerts and 47-year history into one endpoint
- +Hyperlocal ML model updated ~every 10 minutes; vendor cites <1% of temperature predictions deviating more than 5C
- –Reported inconsistency between the Geocoding API and weather endpoints (duplicate/mismatched city results)
- –Meaningful uptime (99.5%+) and faster data refresh are gated behind higher paid tiers; Startup targets only ~95%
- –No prominent public real-time status/incident page for self-service customers
- +Single Timeline endpoint unifies geocoding, history, current, forecast, and climate stats in one call
- +Transparent record-based pricing with a genuinely useful 1,000-records/day permanent free tier
- +Deep historical archive (50+ years) interpolated to exact coordinates, ideal for ML training and analytics
- –No public live status page or independently audited uptime history despite marketed 99.9% guarantee
- –Forecast accuracy claims rely on vendor methodology, with no published third-party-verified error figures
- –Thin presence on major review platforms (G2/Capterra/Trustpilot), making independent sentiment hard to gauge
OpenWeather vs Visual Crossing: questions
- Which has better documentation, OpenWeather or Visual Crossing?
- OpenWeather scores higher on documentation and developer experience: 80 vs 78 out of 100.
- Which is more reliable, OpenWeather or Visual Crossing?
- OpenWeather scores higher on reliability: 82 vs 74 out of 100.
- Do OpenWeather and Visual Crossing have a free tier?
- OpenWeather: yes (1M calls/mo (classic) + 1k One Call calls/day). Visual Crossing: yes (1,000 records/day).
- How are OpenWeather and Visual Crossing priced?
- OpenWeather: Per call / freemium tiers. Visual Crossing: Per record ($0.0001).
- Which has more official SDKs?
- Visual Crossing lists 10 official SDKs, OpenWeather lists 5.